Let’s Get Dirty – for National Water Quality Month
August 15, 2016
What’s the difference between dirt and soil?
When it’s on your clothes, it’s dirt. When it’s on the ground, it’s soil. At least that’s what one professor I had used to say.
The Freshwater Trust spends a lot of time thinking about soil and a lot of time with dirt on our boots. What happens on the land has a huge impact on water quality, and unfortunately, unlike your t-shirt and jeans, you can’t wash water.
When making its way into a river, the soil lost from the land becomes sediment and can adversely impact drinking water and habitat for native species. That’s why we’re working with landowners to keep soil on the land nourishing crops and not impairing healthy waterways.
Simple actions — like planting trees on the perimeters of agricultural fields or working with farmers to plant cover crops such as clover and rye grass — can dramatically reduce erosion and have a powerful impact on water quality.
But before any action happens, math does — and a whole lot of it.
When we see a river choked with sediment, how do we know where all that muck came from? Over hundreds of square miles, how can we find the places where the biggest loads enter the river? If we can find those areas, then we can use our time and resources wisely by working to fix them.
This is where our staff swap their muddy waders for computer screens and equations.
First, they examine aerial images of an area and a stack of geospatial data about the land around the river. Data such as field boundaries, types of crops, how the crops are irrigated, how much the land slopes, what the soil is made of, where the fields drain, and a bunch of other characteristics.
Next comes the modeling. This kind of modeling involves formulas, not high fashion. Our staff says that the “Surface Irrigation Soil Loss” equation is just as exciting as a Parisian runway. Judging by their intense focus on numbers for “base soil loss,” “soil erodibility adjustment factor,” and the like, we’ll just have to believe them.
Using the results of their modeling and analysis, our staff create maps of many agricultural fields based on the estimated loss of soil from the fields over the course of a year. The maps reveal that some areas shed a lot more soil than others.
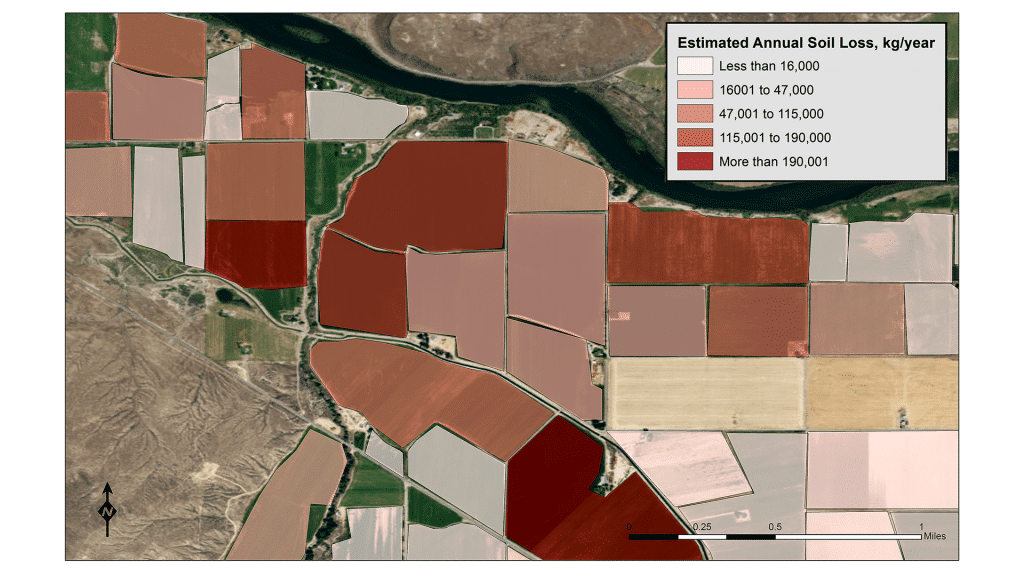
Estimated annual soil loss from specific agricultural fields
All of this allows us to better understand where and how improved infrastructure or management practices will make the biggest difference to improve water quality.
If a farmer replaced their irrigation system with a more efficient one, could that reduce the sediment? Will planting trees in one place have a larger impact than another?
We’re able to answer questions like this, play out multiple scenarios and, thanks to new data and technology, come up with a blueprint of sorts. With information in hand, we can help farmers and other decision-makers understand where limited resources can be focused to get the most environmental benefits in ways that benefit both them and the watershed. Thus, the dirty work begins to keep our rivers clean.
——————————–
August is National Water Quality Month, and keeping soil out of rivers is just one of the ways we protect our freshwater resources.
Learn more about the other actions we take to improve water quality here.
#agriculture #analysts #dirt #infrastructure management #maps #modeling #sediment #soil erosion #soil loss #water quality