Big Data May Offer a Big Solution for Rivers
April 19, 2016
Now more than ever, data are being used in multiple sectors to help inform decision-making. As we’re finding out, when used in agriculture, it can mean big things for our country’s rivers.
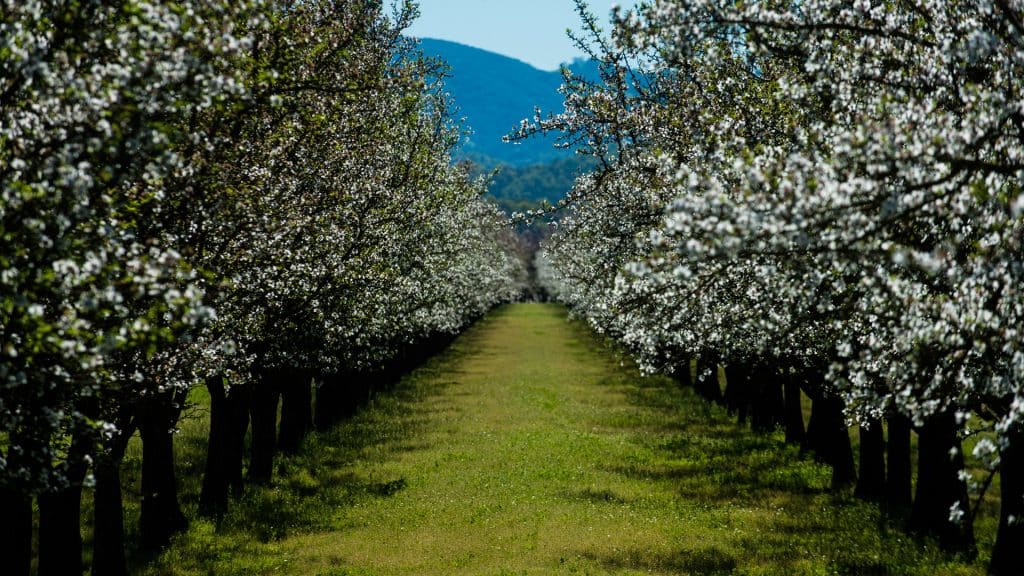
The almond orchards in California are hungry. The trees, which range in height from 13 to 33 feet, are ravenous for nitrogen fertilizer as they leaf out and soak up the California sun in order to produce their high-value nuts. As almond growers apply nitrogen to more than 800,000 acres of orchards throughout the state, they are starting to more closely track the timing and amount of fertilizer applied to their fields.
The benefits of this monitoring? The growers’ pocketbooks and the health of nearby streams and rivers.
For the economic side of the equation, growers often follow the philosophy of the “4 Rs” of nutrient management: Apply nitrogen at the right rate, at the right time, in the right place, using the right source. This level of precision cuts down on lost fertilizer and saves money. For the environmental side of the equation, a reduction in excess nitrogen leads to a healthier river.
The 4 Rs of Nutrient Management
Matching nutrient supply with demand depends on the 4 Rs of nutrient management; when supply is greater than demand, nitrogen in fertilizers can be lost from the root zone and leach into surface water and groundwater, or be converted to nitrous oxide (N2O), a potent greenhouse gas.
- Right Source – Match fertilizer type to plant needs
- Right Rate – Match fertilizer amount to plant needs
- Right Time – Apply fertilizers when the plant needs nutrients
- Right Place – Apply fertilizers where plants can use them
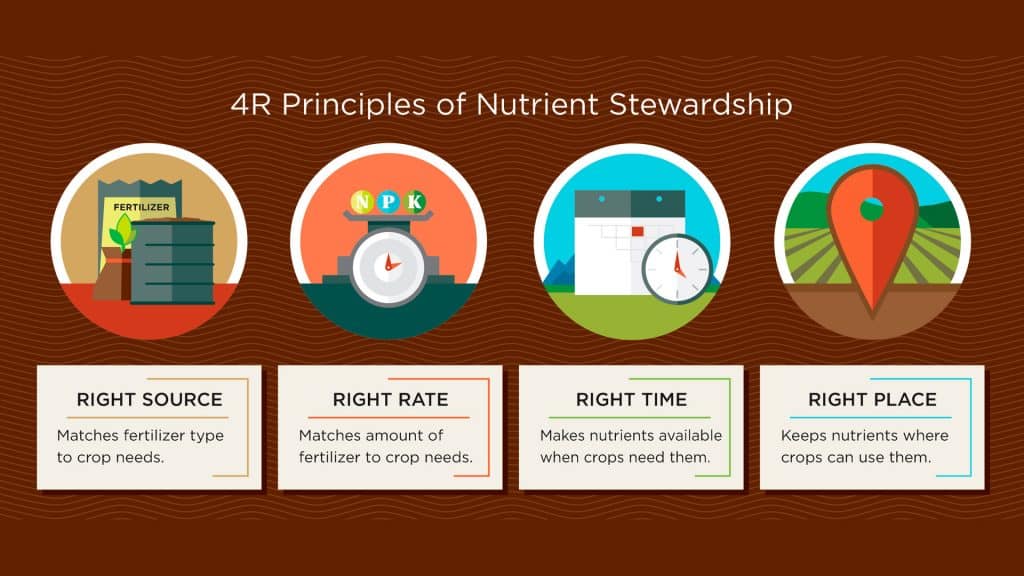
Credit: The Fertilizer Institute
We know some fertilizers applied to agricultural fields do not stay where they’re put. At least a portion of these nutrients washes into streams and rivers and leaches into groundwater. This can result in nutrient enrichment, or eutrophication, which leads to excessive algae and plant growth, and degrades water quality. When the plants and algae die, they sink to the bottom of the river and decompose. The decomposition process consumes the oxygen in the water faster than it can be replenished. Waters without oxygen can result in fish kills and be harmful to human and animal health.
For example, as a result of excess nutrients from the Mississippi River and its tributaries, the Gulf of Mexico had a dead zone in 2015 spanning more than 6,000 square miles, an area larger than the state of Connecticut.
There’s a Calculator for That
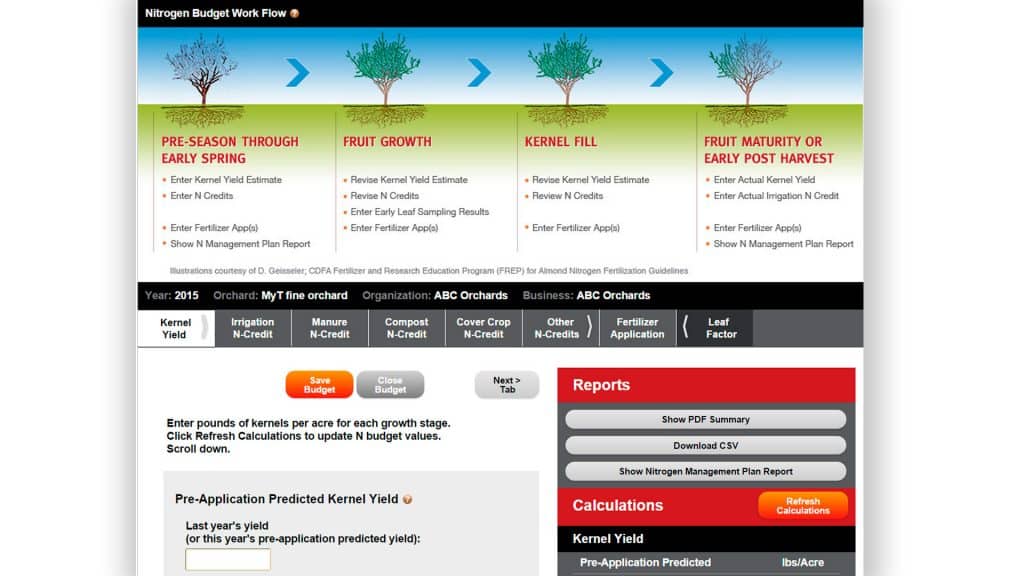
To support its members with nutrient management, the Almond Board of California has created an online nitrogen budgeting calculator. This data management tool supports growers by providing nitrogen assessments designed to increase efficiency and avoid losses – as well as maintain water quality.
The Nitrogen Calculator is a free online tool where growers can enter and store information pertaining to orchard configuration and yields along with nitrogen credits, such as uptake from cover crops. The tool provides a total nitrogen application with amounts by tree-growth stage. As new information is collected throughout the growing season, through leaf samples or yield estimates, the nitrogen budget can be recalculated.
“The Nitrogen Calculator is an integral part of our sustainable nutrient management goal,” said Gabriele Ludwig, PhD, director of sustainability and environmental affairs at the Almond Board of California. “The calculator help growers supply enough of the required nutrient annually to keep trees healthy and provide the high protein nuts we love, while also encouraging Central Valley growers to continuously improve on environmentally responsible agricultural practices.”
Knowing when to apply nitrogen at the right time means more will be used by the plants rather than moving off-site or leaching into groundwater.
“Data is a critical component of sustainable management practices,” said David Primozich, conservation director at The Freshwater Trust. “The ability to collect and record crop and nutrient management practices is good, especially when that data reflect in-season dynamics, such as unusual weather events or variability across fields or regions. As the data are aggregated, we can begin to track progress toward water quality objectives over time.”
Nitrogen Reporting for California’s Irrigated Lands
California regulates discharges, or runoff, from all irrigated agricultural lands to both surface and groundwater through the Irrigated Lands Regulatory Program (ILRP). There are approximately 6 million acres from 40,000 growers enrolled in ILRP. 2015 was the first year many growers-depending on size and location of their fields-started to report nitrogen application and management plans. The Almond Board’s Nitrogen Calculator enables producers who are using the tool to report the relevant information to the appropriate regional water quality coalition.
The Almond Board isn’t the only California initiative seeking to facilitate nutrient management.
Campbell’s Soup has set a goal to reduce water and fertilizer use by 20% per pound of tomatoes by 2020. One way has been through conversion from furrow irrigation to a subsurface drip system, a system used by Bruce Rominger, of Rominger Farms in Winters, California, who grows tomatoes for Campbell’s. Drip irrigation allows Rominger to closely monitor water usage throughout the field and apply just enough water directly to the root zone. This reduces fertilizer losses through leaching. Additionally, his farm tests the soil for residual nitrogen and applies just enough additional nitrogen fertilizer when the tomato crop is planted.
“Farmers realize that nitrogen can have damaging effects in other places in the ecosystem,” said Rominger in an Agricultural Sustainability Institute interview. “I drink the water, my family drinks the water pumped out of the ground here. We don’t want nitrate levels going higher here and we don’t want to damage ecosystems downstream somewhere.”
The winegrape industry is also using big data to make more well-informed decisions. The California Sustainable Winegrowing Alliance developed the California Code of Sustainable Winegrowing. Early adopting wineries, such as Francis Ford Coppola and Rodney Strong, are using the Code and innovative technologies like high-resolution aerial imagery and weather station monitors to track moisture loss to fine-tune irrigation.
“In addition to walking our vineyards, we can also view a natural thermal differentiated index to see which sections have been properly irrigated and which ones are too dry or overwatered,” said Lise Asimont, director of grower relations at Francis Ford Coppola Winery, in the Sonoma County Winegrowers 2015 Sustainability Report. “We thought we were good at watering, and now we know we can improve our conservation efforts.”
The evolution of data to create a big solution for water is an ongoing one. While more precise data might be desirable to many, the quest for all that data has created reporting redundancies and privacy concerns for growers. Additionally, while the relatively well-funded Almond Board can roll out its Nitrogen Calculator to members, there remains a challenge to develop similar tools for lesser-value crops and smaller sectors of agriculture.
Partnerships to increase pace and scale
One way to address this concern is to create partnerships in the data community to help speed up development and scale up the reach of data management tools that address the needs of an entire watershed.
On this front, The Freshwater Trust has worked with Google to expand the organization’s StreamBank BasinScout™ assessment method for modeling sediment runoff and solar input reductions in the agriculture-heavy Russian River basin. Historically, the Russian River and its tributaries provided critical spawning areas for the now endangered Coho salmon and threatened Chinook salmon.
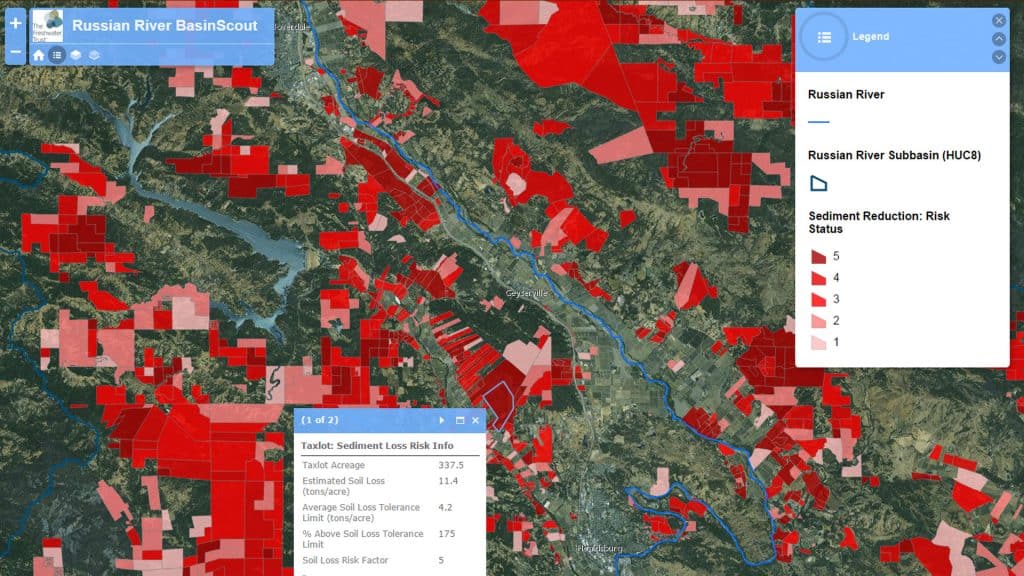
Analysis of potential sediment reductions in the Russian River Basin. Credit: The Freshwater Trust
An assessment with StreamBank BasinScout™ uses inputs of aerial imagery, topography, soil and crop data, climate data and land management practices. The resulting output displays a map of fields at risk of high sediment runoff. These fields represent where a range of conservation actions and potential improvements in on-farm practices may be most effective for improving water quality.
“We are looking for ways we can work with data faster,” said Sharon Petras, ecosystem services analyst for The Freshwater Trust. “Aerial imagery provides us with a good foundation for assessment, and then analysts spend additional time examining fields and on-farm practices in detail. When we can automate more pieces of this analysis, then we can assess more watersheds for needed restoration.”
The ultimate goal for the environment is an approach where all the data collected can be turned into an expansive, holistic view of watershed health. Whether almonds, tomatoes or grapes, many growers are ready to engage or already engage in on-farm conservation practices. Data management tools are helping these producers document their actions and measure the benefits of these actions on reducing nutrient loads.
“Data sit at the crossroads of food production and conservation,” said Primozich. “We’re seeing more and more that the right data at the right time creates land and water management options that sustain working lands and fix rivers.”
#agriculture #almonds #BasinScout #California #data #freshwater Magazine Spring 2016 #monitoring #Nitrogen Calculator #nutrient reduction #orchard #rivers